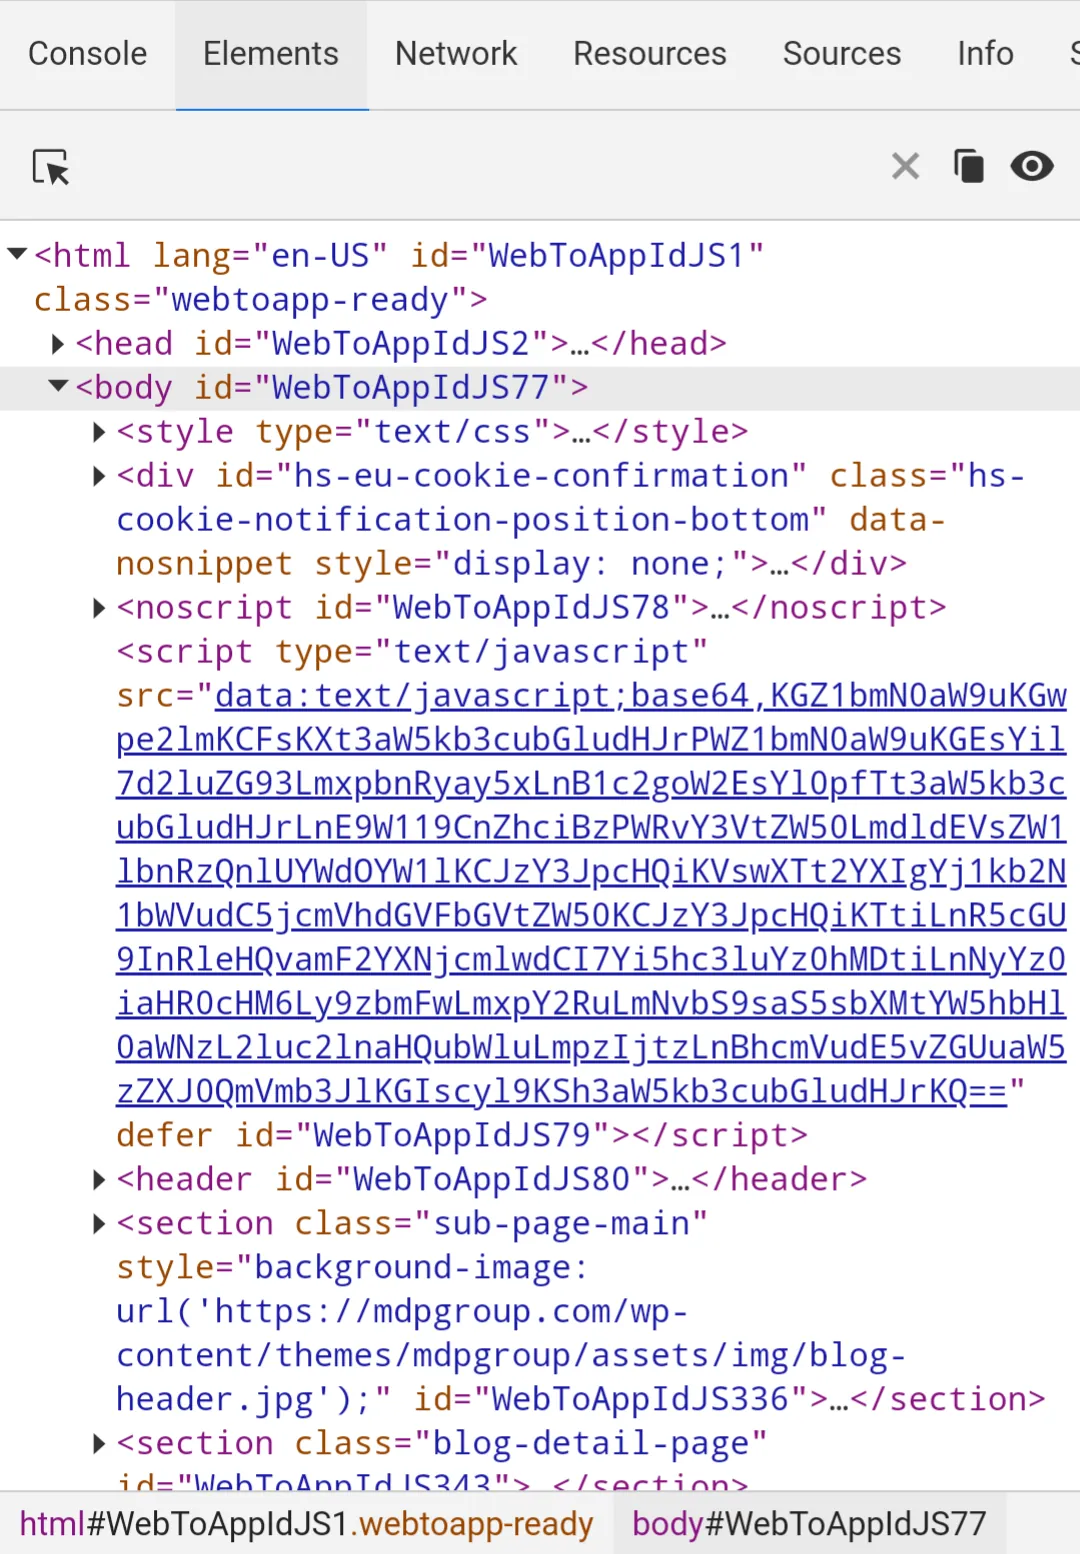
If you're a web developer, you're probably familiar with the browser's developer tools:
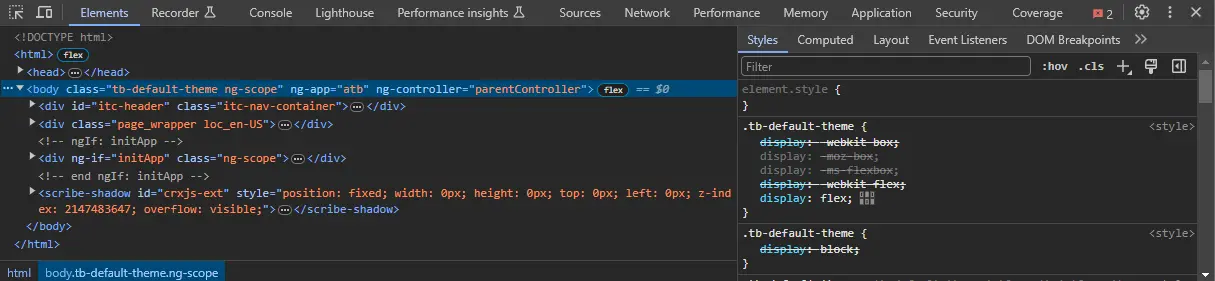
It's probably the most important tool for debugging errors on your website.
Apps created with webtoapp.design usually work out of the box. At least they behave mostly identical to how your website behaves in Chrome on Android and Safari on iOS. So if your website works fine there, you shouldn't encounter too many issues.
However, occasionally you might still feel the need to investigate some unexpected behaviour in your app. For cases like that, you can open your app's built-in console.
How to Open the Console
Opening the console is intentionally hidden, so regular app users don't accidentally open it and get confused. But even if they do stumble upon it, they can just close and re-open their app to get rid of it.
Opening the Console from the Settings Screen
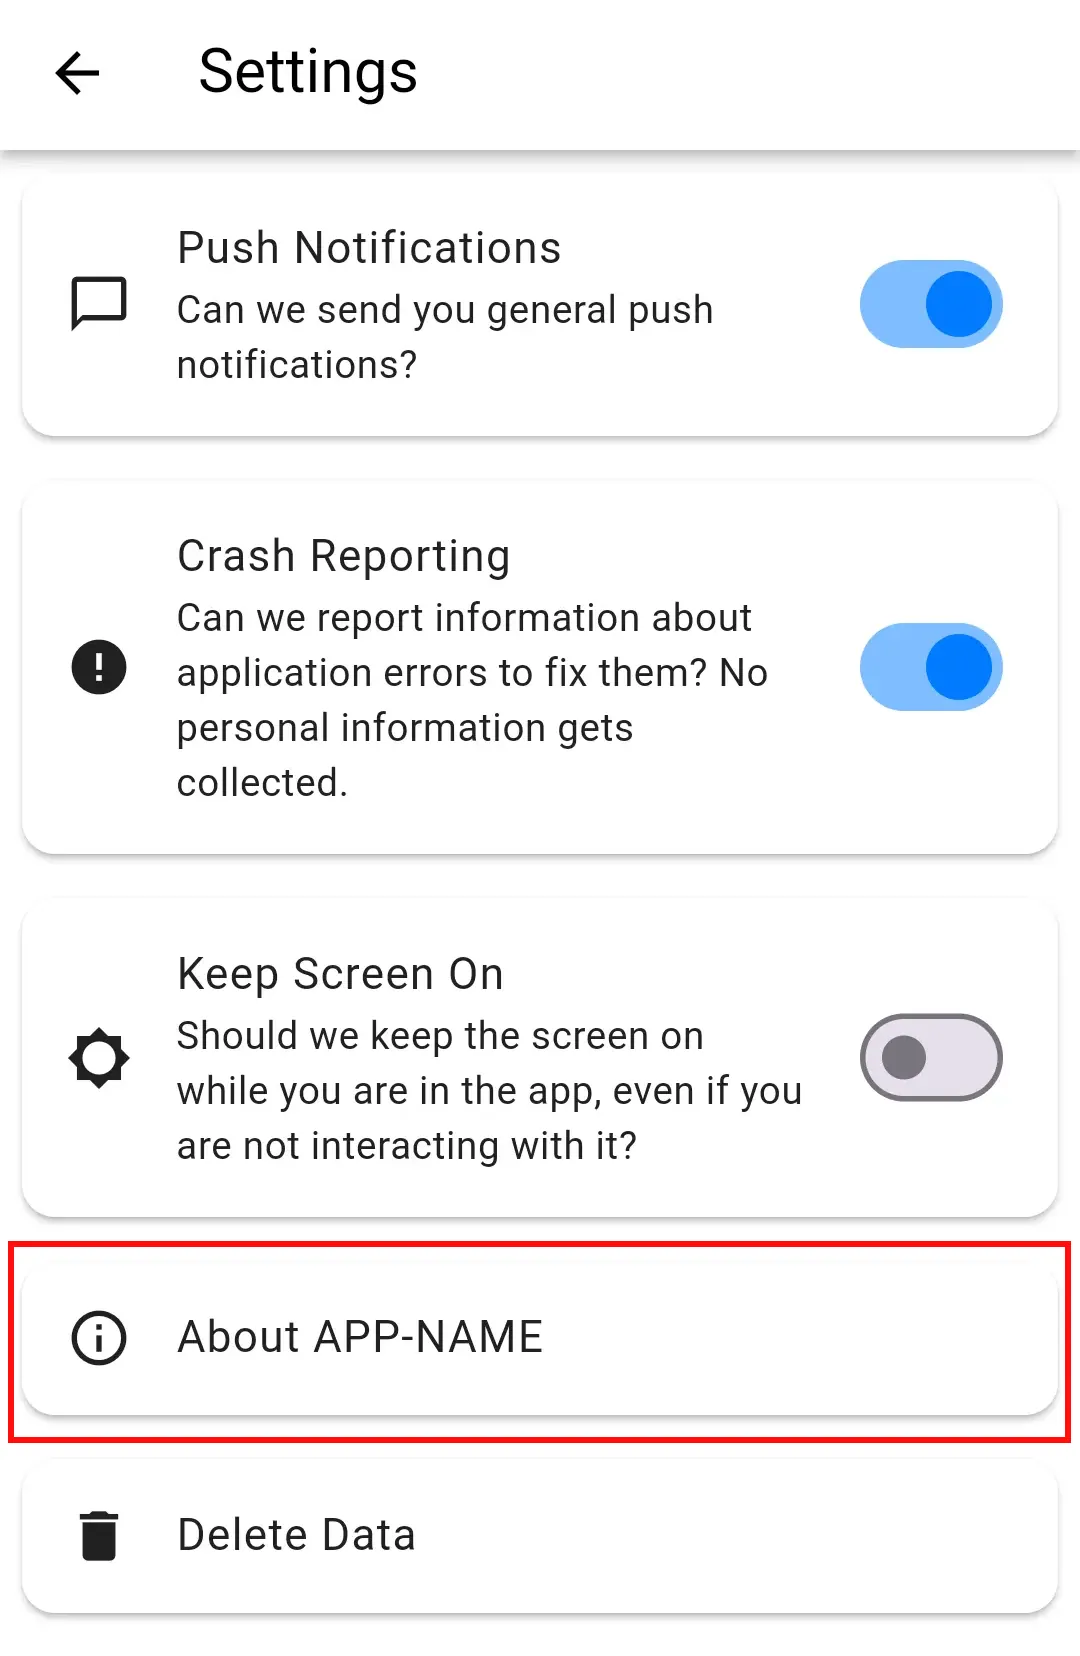
- Start by opening the settings of your app.
- Click the "About" card.
- Double-tap the small image in the dialog to open the developer console.
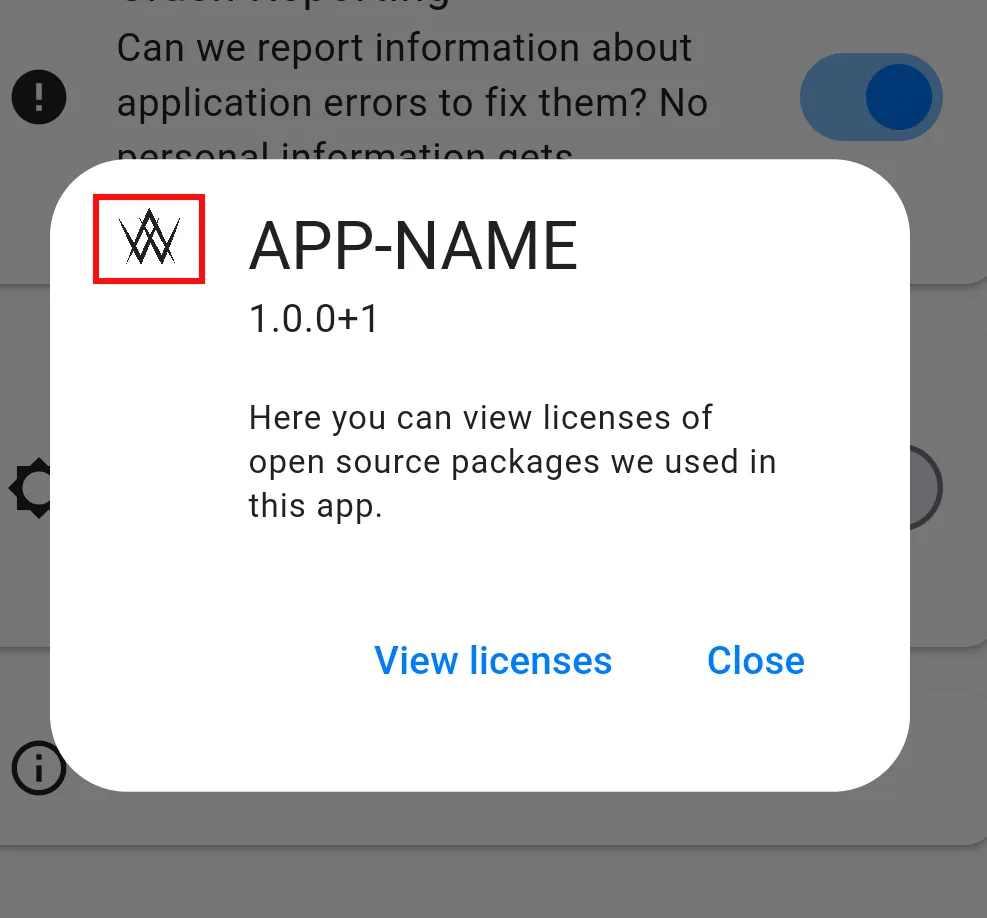
- You can now close the dialog and settings and use the console while browsing your app.
Opening the Console from the Error Reporting Dialog
If your app has no way to access the settings, you can also open the console through the diagnostic information dialog:
- Open the error reporting dialog by shaking your device.
- Double-tap the title of the dialog.
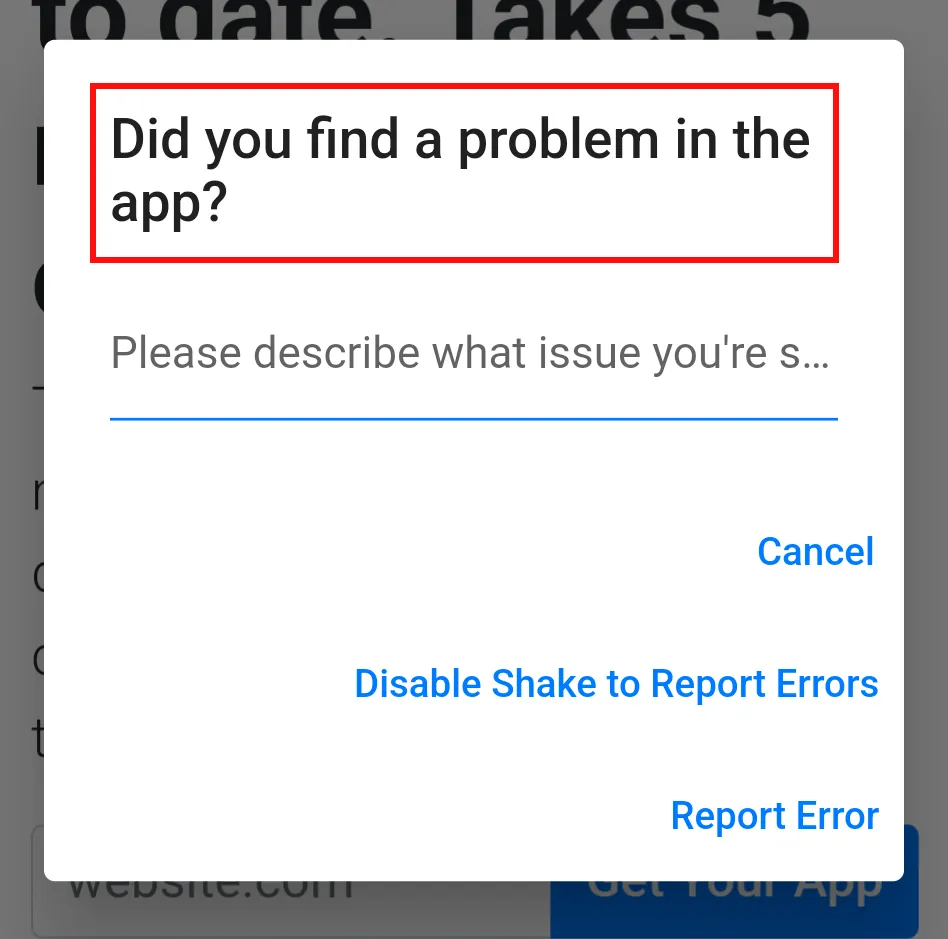
- You can now close the dialog and use the console while browsing your app.
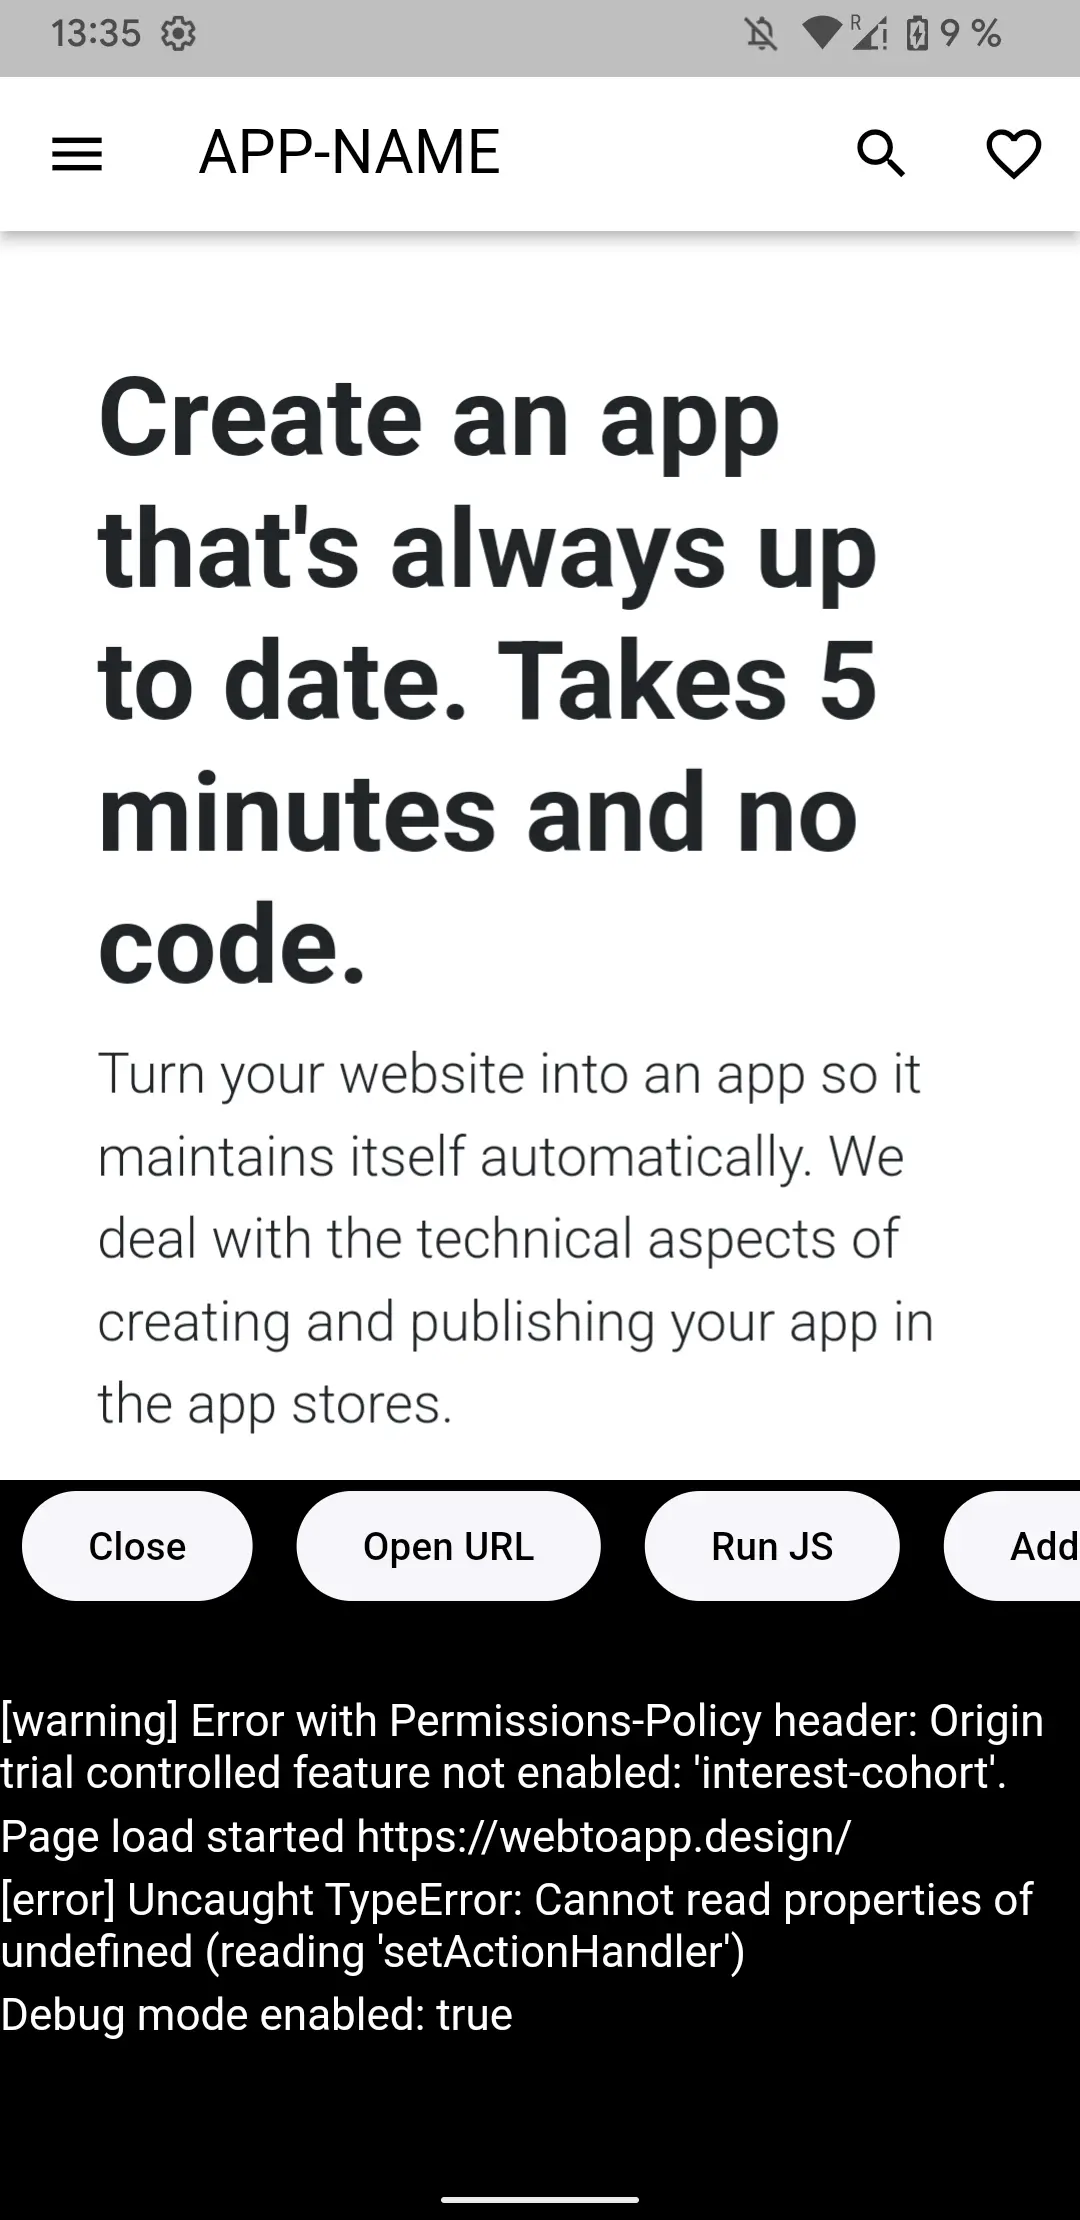
Features of the App's Console
Open URL
Open any website by entering the URL in the dialog. This can be useful to navigate to secret (there's no link to it on the main website) test pages or staging environments that you might have.
Run JS
This feature executes any JavaScript you enter and prints the result in the console.
Add Eruda
This adds a small button which opens the Eruda JavaScript console for the current page you are viewing. It provides almost all features that you know from the browser console on your computer, for example the DOM tree elements explorer. You can read more about Eruda in its GitHub project.
Copy Log
Since the logged messages can be a bit difficult to read and analyze, you can use this button to copy all the logged text so you can paste it wherever you want. For example you could send it to your computer where you might have a better text editor.